New Graph, Table and Spool Features
Each version of EViews has always introduced improvements to our powerful graphing and presentation quality output engine, and EViews 11 is no different. Here are some of the improvements we've made to graphs in this version.
GEOMAPS
EViews 11 introduces the ability to load and display geographical maps. Currently EViews supports maps contained in the shapefile file format.
Once a map has been loaded into an EViews workfile, it can be tied to the data in that workfile, allowing displaying of series values inside the map, or use of the new colormap engine to color the geomap based upon series values.
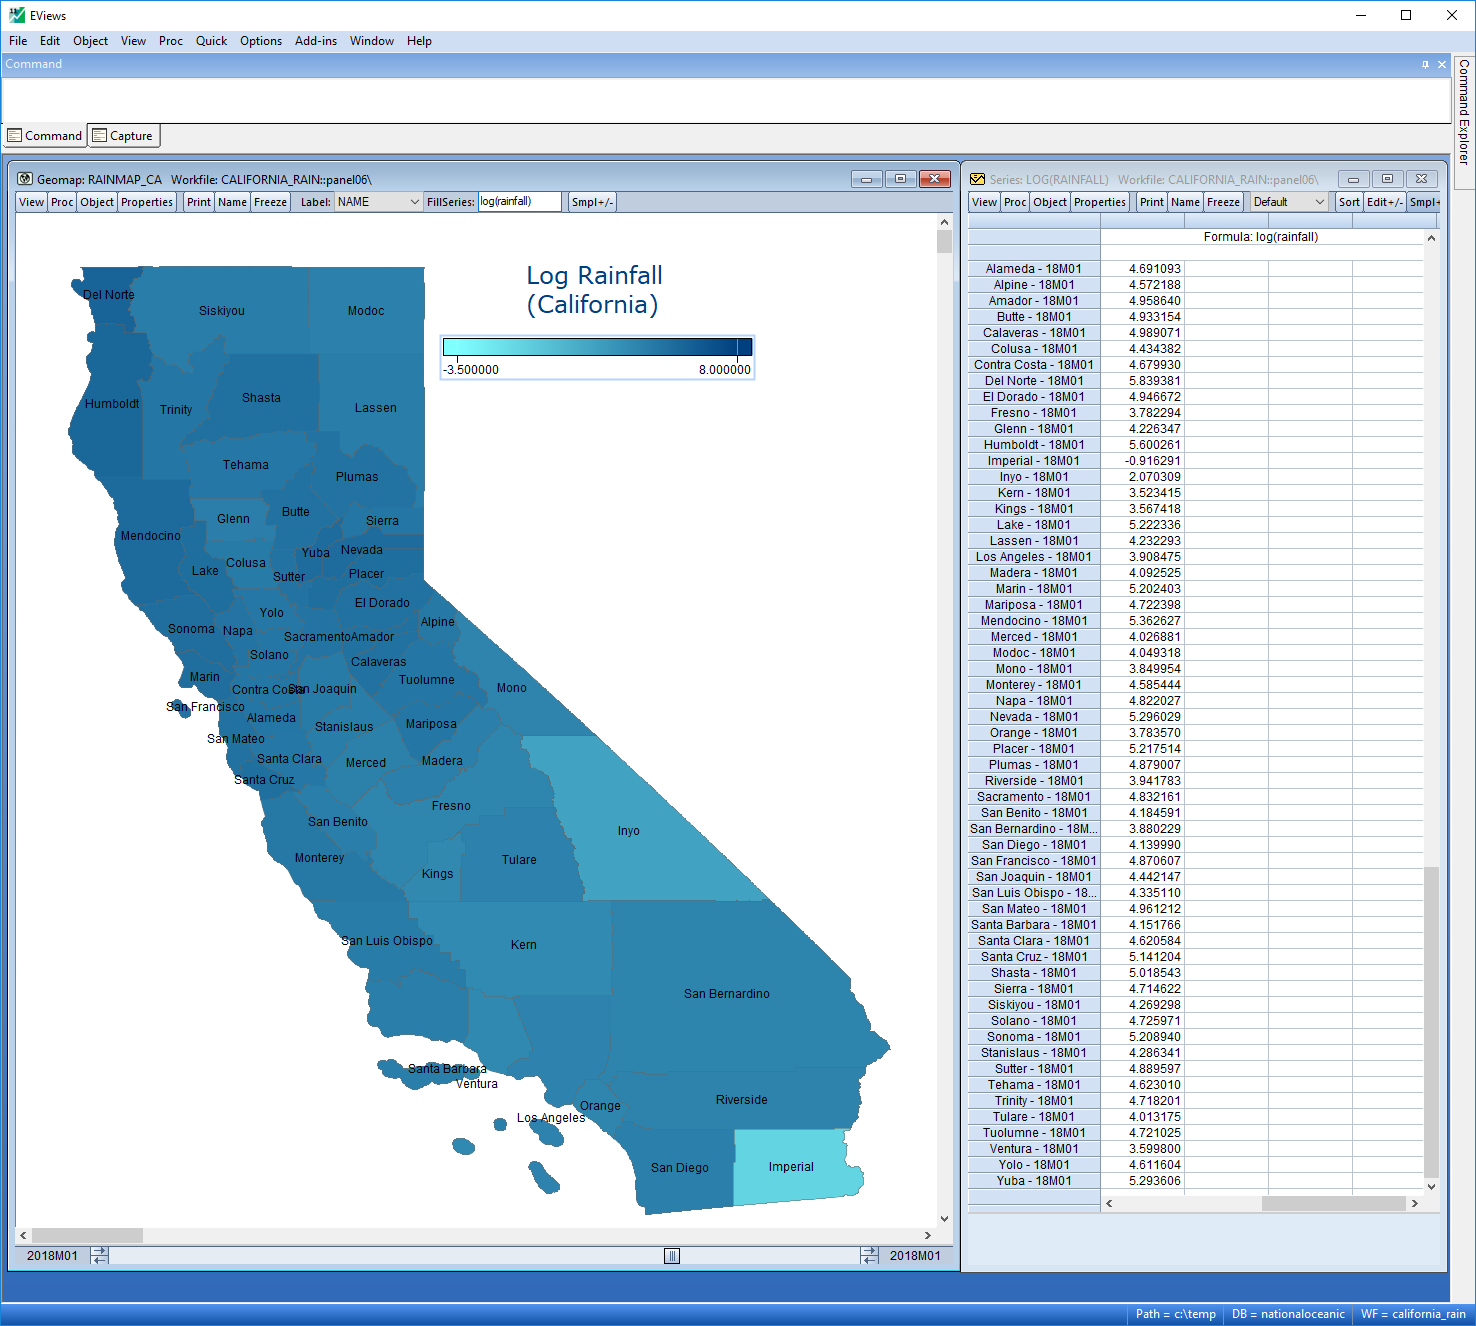
Geomap of California counties shaded by rainfall in March 2018
In panel workfiles you can even adjust the sample period being displayed to different date ranges.
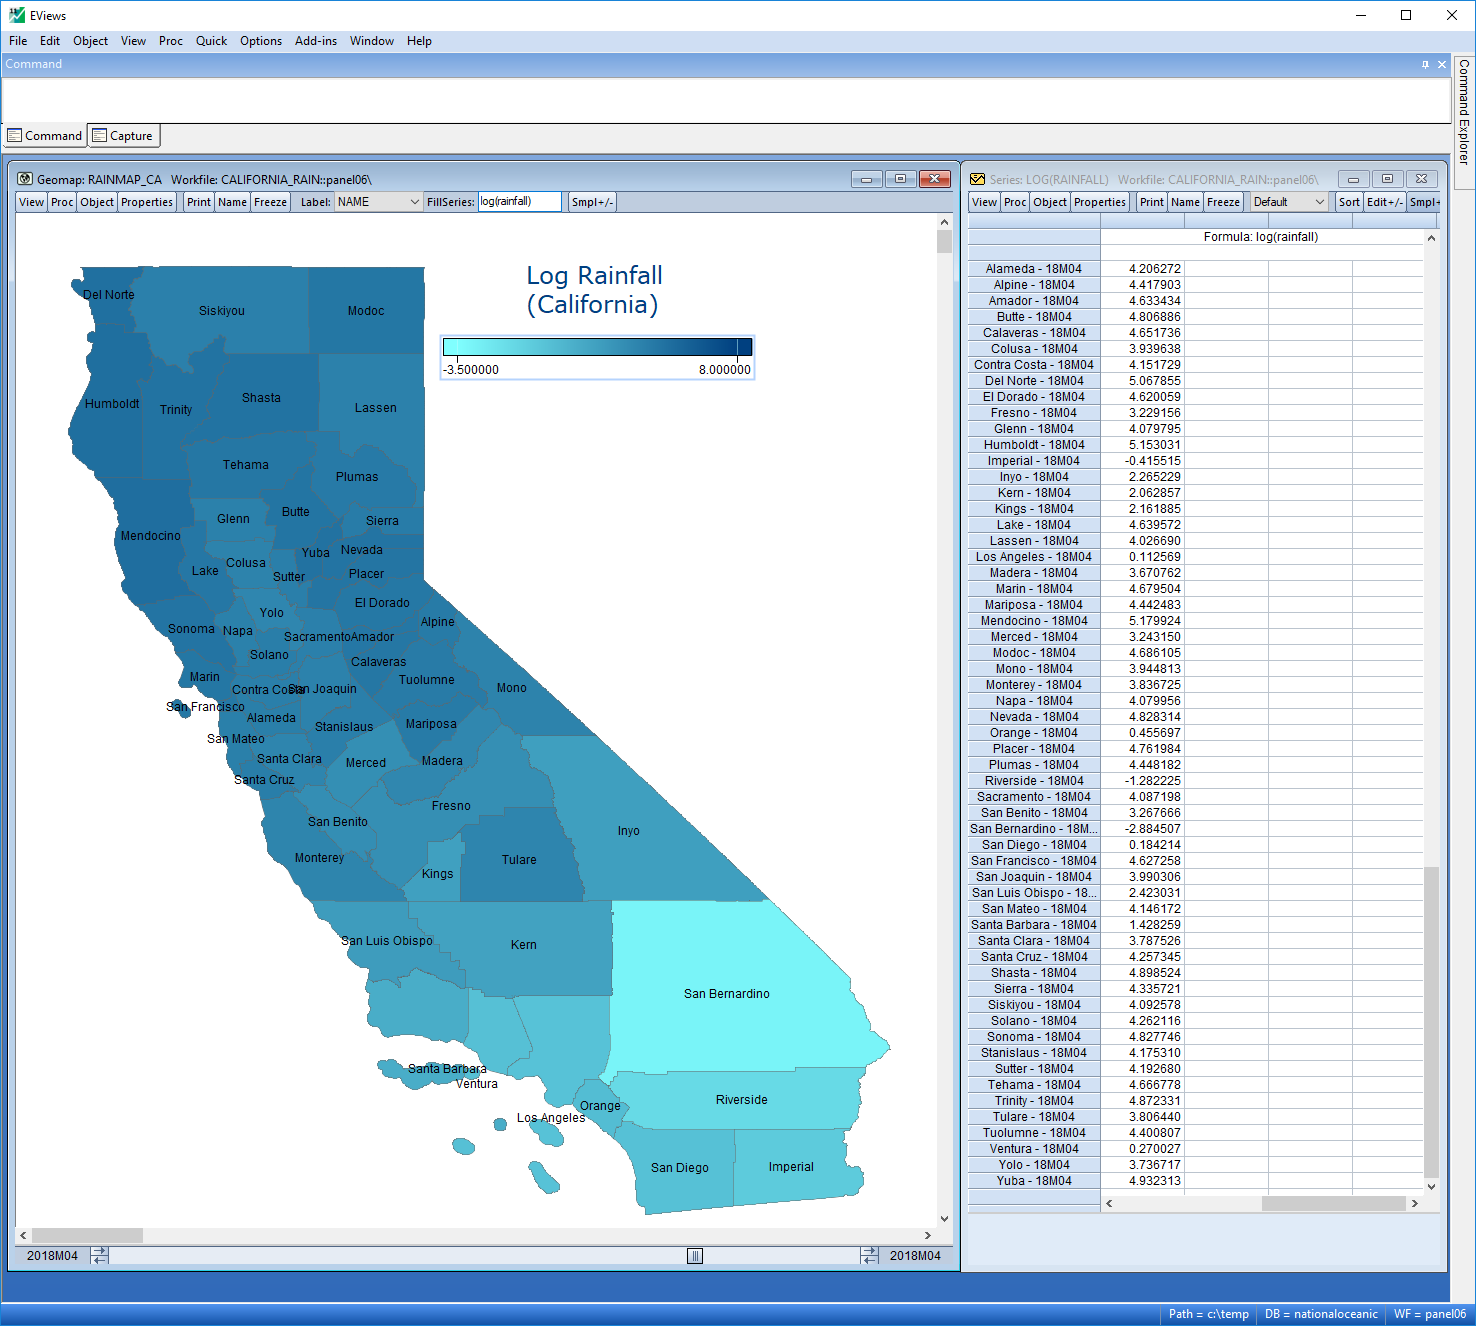
Geomap of California counties shaded by rainfall in April 2018
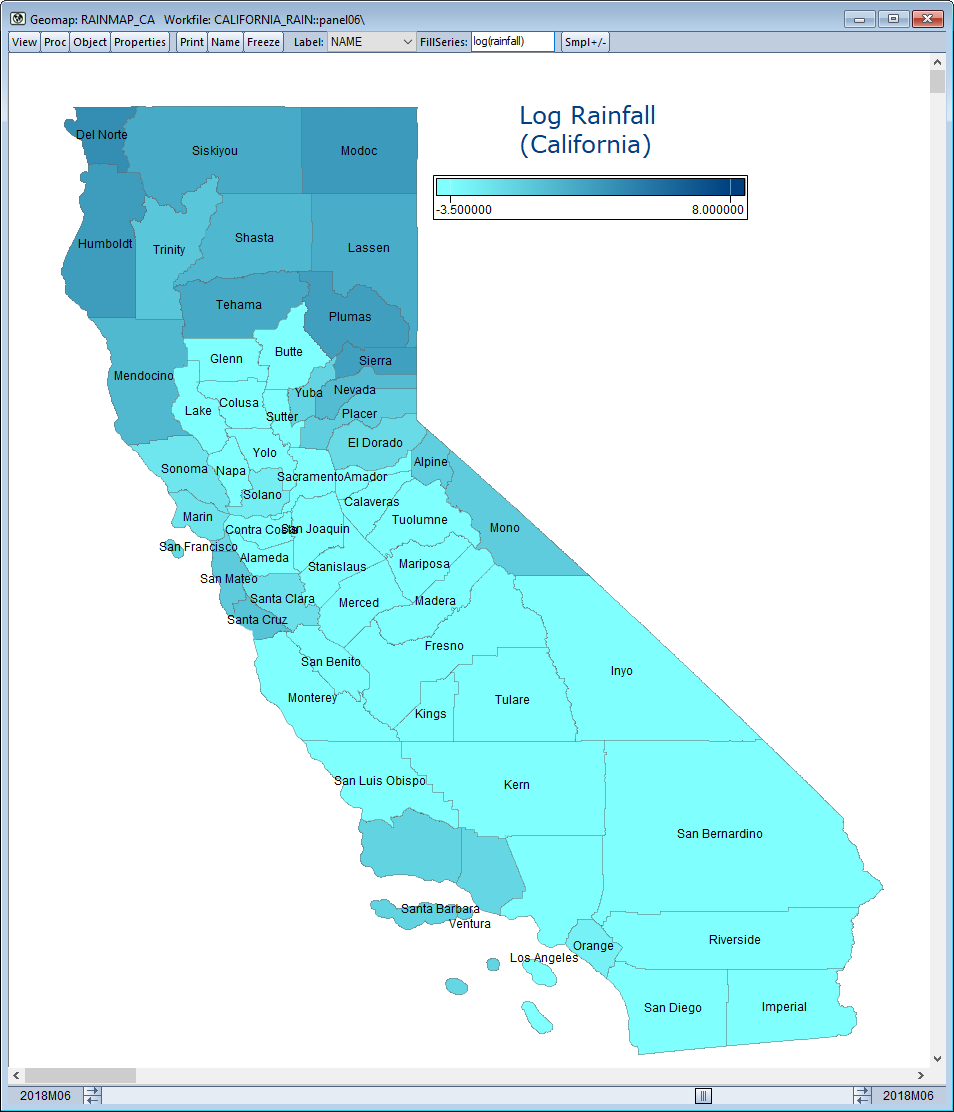
Geomap of California counties shaded by rainfall in June 2018
Scrolling through geomap of California counties November 2017 through December 2018
The addition of the US Census and National Oceanic and Atmospheric Administration databases to EViews 11 makes fetching data for US geomaps particularly easy.
FAN CHARTS
EViews has many procedures that store simulations in to panel pages, whether from VARs estimated with Bayesian techniques, from the Model object (allowing simulation of any classical single or multiple equation estimation), or from manual simulations. You can now view fan charts of those simulation with the new fan chart type for panels.